
Your webpage loading speed is the first thing that truly matters to a visitor of your website. In today’s digital world, where everything is just a click away whether it is a service or any product, website loading speed is the deciding factor for an online business. If you own or manages a WordPress website, it is very important to maintain the speed of the website to offer an optimal browsing experience to the end users. Speed is the vital parameter that build or break the impression of the Website.
Commonly Used Web Performance & Speed Testing Tools
To test out how fast a website loads across various browsers and devices, WordPromise recommends 3 most used performance & speed testing tools. The good thing is that you can make these tests by yourself and don’t really need an expert to test and read the result data. Because the testing tools available on the Internet measure website speed based on various algorithm, which may display slightly difference in various web vitals of your website. However, you should not be concerned about that if your website speed is in A grade which ranges from 90% and above.
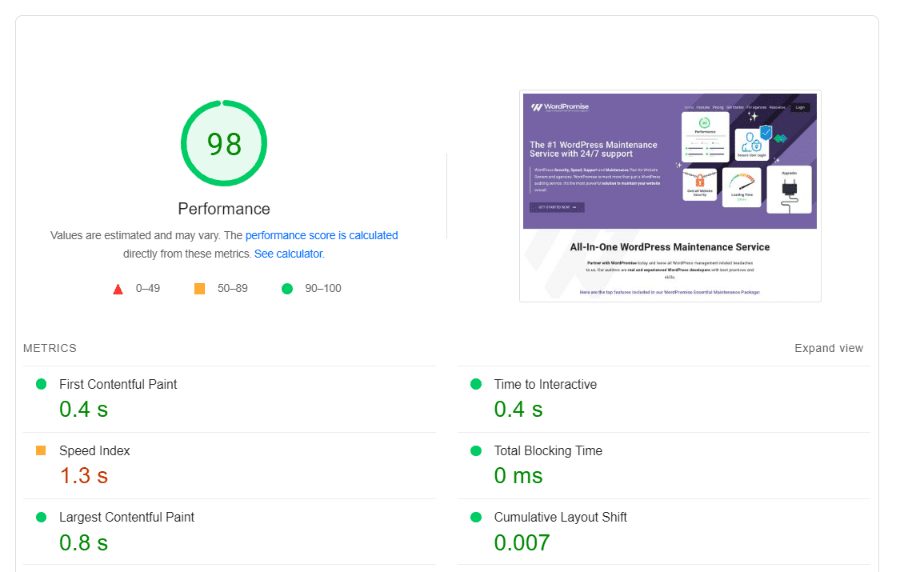
PageSpeed Insights (PSI) is a tool provided by Google that check your site performance across devices and provides the best suitable recommendations and suggestions about how the pages on your site can be better improved on multiple type of devices such as mobile and desktop.
GTmetrix tool is also used very widely across WordPress community. It gives an insight to the website owners in order to easily test the performance of their webpages and optimize the site for both speed and SEO things.
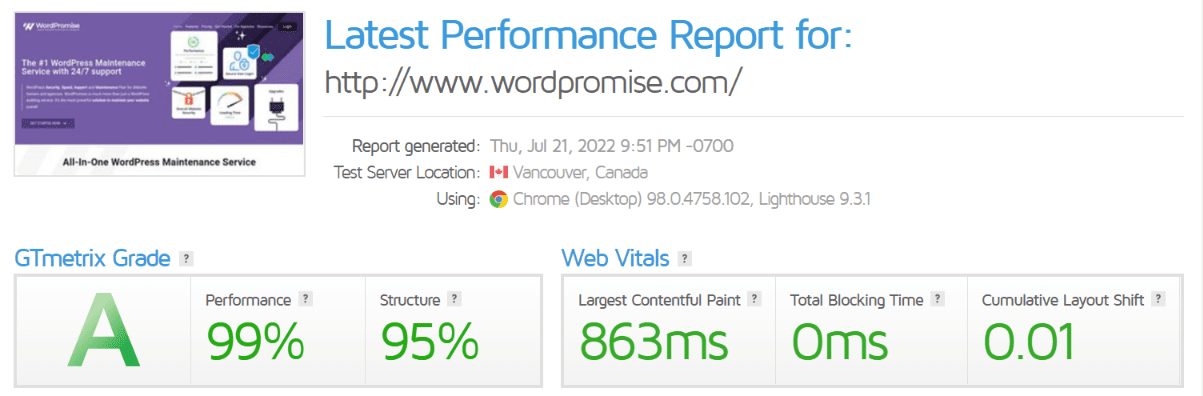
GTmetrix tool offer multiple test locations for analysis of sites in order to best represent your website performance, in both actual loading time and performance best practices.
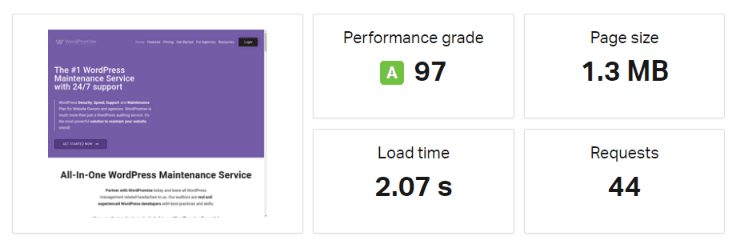
Pingdom is a popular free web speed test tool, a monitoring solution for your websites, again one of the trusted industry proven tools for easy and powerful web performance and digital experience monitoring. Using Pingdom you can Start increasing your web performance generally in minutes after implementation.
Pingdom offers services such as uptime monitoring, page speed monitoring, transaction monitoring, server monitoring, and visitor insights (RUM).
Broadly, all above tools, more or less, use the same set of Web Vitals Parameters to access the performance of the site. Let’s go through the important Web Vitals Parameters:
Commonly used Performance Parameters/ Web Vitals
First Contentful Paint (FCP) is when the browser renders the first bit of content from the Document Object Model (DOM), providing the first feedback to the user that the page is actually loading.
Ideally, FCP should occur within 1.8 seconds or less to provide a good user experience to the end users of your website.
Largest Contentful Paint (LCP) is a Core Web Vital metric that depicts how long it takes the largest visible element on the page to become visible in the device viewport.
LCP score should be less than or equal to 2.5 seconds.
Total Blocking Time (TBT) measures the sum of all blocking time before it becomes usable. It is the sum of all time periods between First Contentful Paint (FCP) and Time to Interactive (TTI) when a task length exceeds 50ms — a low TBT helps ensure that the page is usable.
TBT score should be under 50 ms.
Cumulative Layout Shift (CLS) depicts the visually stability of a page. The visual stability is calculated by how many unexpected layout shifts occurs during the loading of the page. A low CLS value confirm that the page appearance is delightful to the end users.
CLS: Better to have a CLS score of 0.1 or less.
First Input Delay (FID) is a Core Web Vitals metric that calculates the responsiveness of your webpage by examining how long it takes for the browser to respond to the first user’s interaction with a page.
A good FID score should be under 100 milliseconds
Time to Interactive (TTI) is an important web vital that defines the point at which the page is both visually rendered and capable of consistently responding to user input or any other form of a user interaction. TTI goes hand in hand with Total Blocking Time because together, they provide insights into your page’s responsiveness to a user’s action.
Zero to 3.8 seconds is considered good for a fully interactive page.
Load Time: The load time is measured as the time when the page finish processing all of the resources (Example: text, images, CSS, and JavaScript files) on the page.

Total Page Size is calculated as the total sum of all the resources that are needed to render your page, including the HTML file, CSS and JavaScript files, images, multimedia, third-party domains, everything. This metric help website administrator to optimize the page resources as per desired levels.

Conclusion
Website speed test tools – like Google PageSpeed Insights, GTmetrix and Pingdom – enables you to measure your site’s speed and identify areas of improvement. For DIY enthusiast, understanding the Website speed test tools to properly measure the site’s speed, can be effectively achieved & implemented.
These metrics will enable you with information that is required to optimize important web vitals by making tweaks and changes to your website pages.
It is quite possible that you are not sure about what is required to optimize the Core Web Vitals and what tweaks are required to configure them optimally. You can talk to one of our expert WordPress Auditor at WordPromise for assistance and make your website rocket fast.